

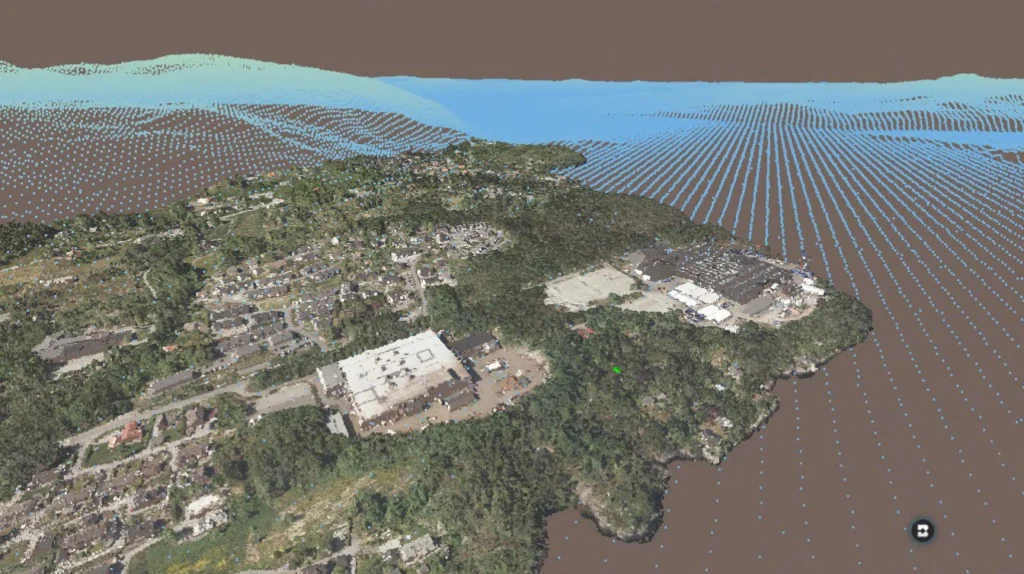
Figure 1. A detailed 3D aerial model communicates an extraordinary amount of information. Its realistic appearance alone does not document its scale, control, datum, positional accuracy, or suitability for measurement.
Seeing Is Not Measuring
We live in a world filled with extraordinary images. Google Earth can show us a house from above. A drone can photograph an entire construction site. A laser scanner can produce a realistic three-dimensional view of a building. LiDAR can reveal the shape of the ground beneath vegetation. A point cloud can be colored so accurately that it resembles a photograph.
These images are powerful. They help us see, understand, explain, and remember places. But they can also create a dangerous assumption: If I can see it clearly, I must be able to measure it accurately.
That is not necessarily true. A picture may show what something looks like and where it is generally located. By itself, however, it does not tell us its scale, positional accuracy, collection date, processing history, coordinate system, elevation datum, sensor calibration, ground control, or independent checks.
Resolution tells us what we can see. Accuracy tells us how closely the information represents its true position or dimension.
The Ruler on the Screen
Many mapping systems allow a user to click two points and receive a distance. The software may report that distance to several decimal places, creating a powerful impression of certainty. But the number of displayed digits does not establish the accuracy of the source information.
If an image is positioned only within several feet, reporting a distance to the nearest hundredth of a foot does not improve the measurement. It only adds digits. Precision in the display does not guarantee accuracy in the result.
The first question should not be, “What number did the computer give me?” We should ask what we are measuring from, how the information was created, what accuracy it supports, what it is referenced to, and whether it is accurate enough for the decision being made.
What Makes an Image Measurable?
Images can support measurement when they are collected, processed, controlled, and verified for that purpose. Photogrammetry has been used successfully for generations, and modern drone mapping can produce orthophotography, surface models, contours, quantities, and three-dimensional information.
These products do not become survey-grade merely because they were produced by a drone or sophisticated software. Reliable measurement may require a calibrated sensor, proper collection geometry, known ground-control points, independent checkpoints, defined datums, appropriate processing, evaluation of error, and field verification of important features.
The meaningful distinction is between an image created mainly for visualization and an image product created, controlled, tested, and documented for measurement.
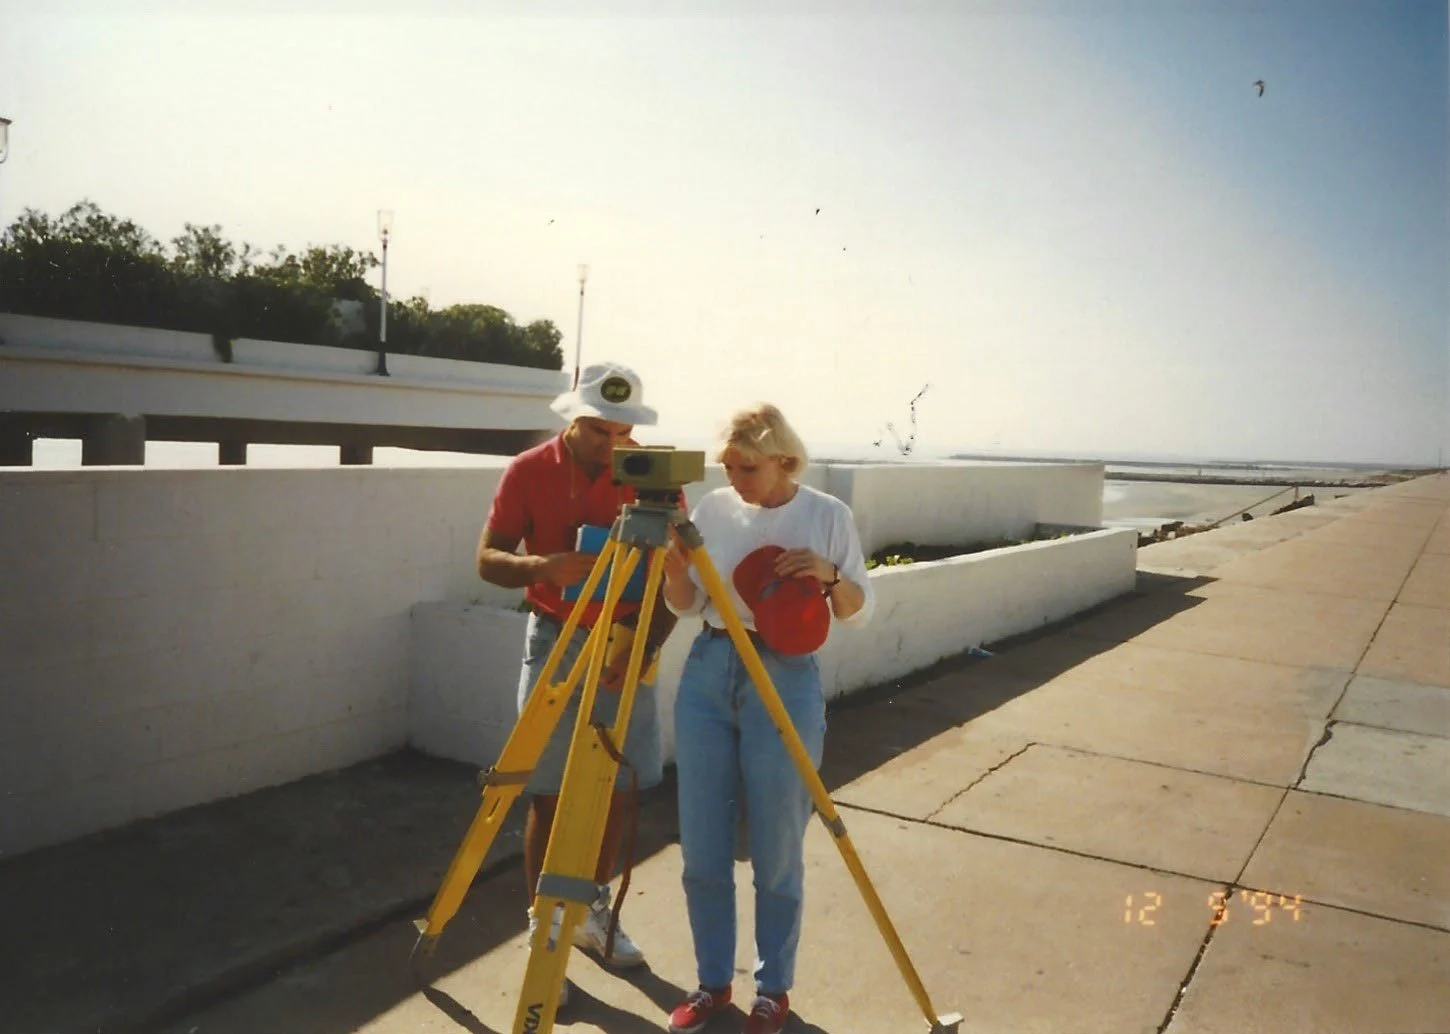
Figure 2. Reliable measurement begins in the field. Equipment setup, known control, observation procedures, documentation, and independent checks establish the connection between the digital product and the real world. Dr. Gary Jeffress, RPLS, and Nedra Jo Townsend, RPLS, LSLS, December 1994, first digital level CAMERA.
Control Connects the Picture to Reality
Control gives measured information a dependable position and reference. It connects the image, point cloud, or model to a coordinate system and elevation datum so that the work can be repeated, compared, and independently checked.
The control photograph may not look as dramatic as the finished digital model, but it represents the foundation beneath every trustworthy measurement. Pole height, instrument setup, calibration, centering, backsight, datums, units, and check observations may be invisible in the final picture. Their effect is not.
One wrong control coordinate, antenna height, unit, or datum assumption can influence an entire dataset. Thousands or millions of observations may repeat the same mistake. More data does not automatically mean better data.
LiDAR and Point Clouds
A LiDAR point cloud may look like a three-dimensional photograph when displayed on a screen, but it is actually a collection of individual measured points. Each point may contain coordinates and other attributes. When the points are collected with suitable equipment, tied to reliable control, processed correctly, and checked independently, the point cloud can support accurate and repeatable measurements.
The realistic appearance of a point cloud does not prove its accuracy. Separate scans can fit smoothly while the complete model is shifted or rotated relative to the required datum. Reflective surfaces, vegetation, water, movement, weak geometry, or processing decisions can also create unreliable points.
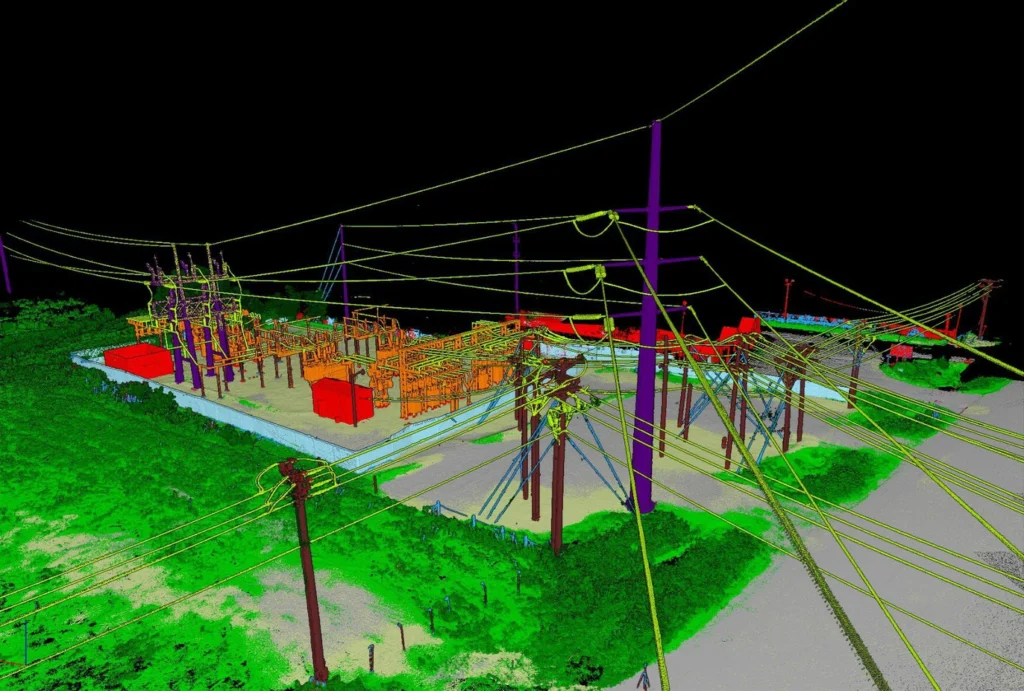
Figure 3. Classification separates ground, structures, equipment, conductors, pavement, and vegetation. The point cloud becomes organized geospatial information, not simply a colorful picture.
Classification organizes the measured points into meaningful categories. That makes the model far more useful for engineering, utilities, asset management, and planning. But classification must also be reviewed. A point placed in the wrong category can be visually convincing and operationally wrong.
Survey-Grade Means Measurable
The culvert image demonstrates the difference between simply seeing an object and measuring it within a controlled digital environment. The point cloud allows the pipe opening to be identified and a diameter to be calculated directly.
The displayed diameter is 1.998 feet. That precision is meaningful only if the collection, registration, control, processing, surface selection, and verification support it. The software can draw the circle and report the number; the measurement system must justify confidence in the result.
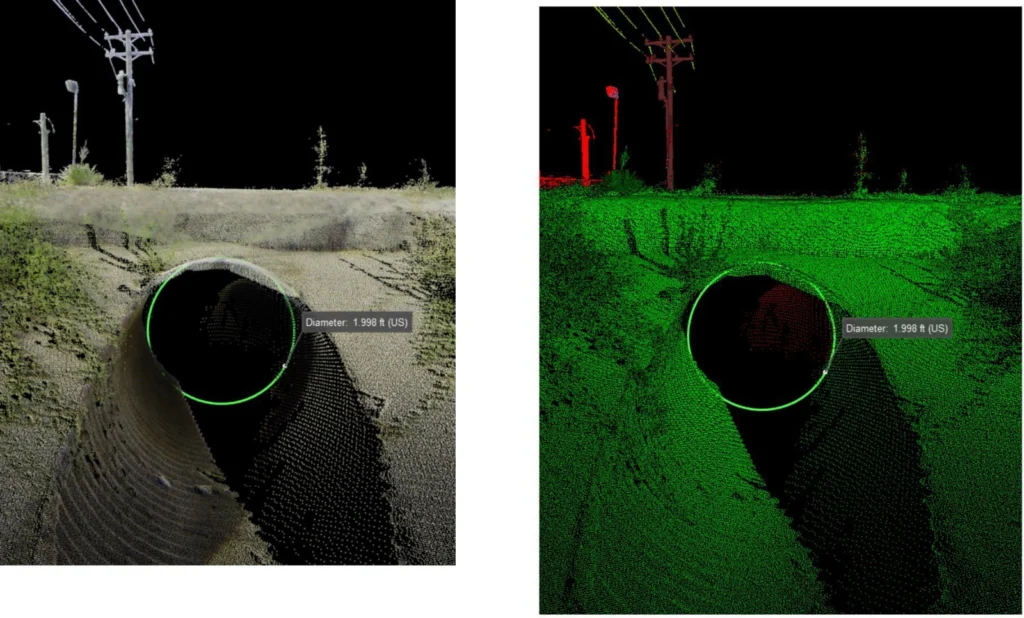
Figure 4. A registered point cloud supports a direct check of the culvert diameter, shown as 1.998 feet. The picture communicates the feature; the controlled dataset supports the measurement.
A Digital Twin Must Be Tied to Reality
A digital twin can help owners visualize facilities, manage assets, compare existing conditions with design, monitor change, and plan maintenance. But it is only as dependable as the information used to create it.
If the model is intended only for visualization, approximate information may be sufficient. If it will be used to determine clearances, elevations, quantities, deformation, utility conflicts, construction tolerances, or critical asset positions, the measurements must be tied to reliable control and checked against reality.
A visually impressive model may still be unsuitable for an engineering or construction decision. The visualization is not the quality-control report. The fact that the model looks right does not prove that it measures right.
The Picture May Be Good Enough
Not every image needs to support survey-grade measurement. A photograph documenting site conditions, an aerial image used for general planning, or a GIS map showing a public project may be entirely adequate. The question is not whether the picture is perfect. The question is whether it is accurate enough for the decision being made.
A picture may answer what the property looks like, whether the area is wooded, what features are visible, and where the project is generally located. More reliable measurements may be required to establish a boundary, elevation, clearance, easement relationship, construction tolerance, material quantity, or utility conflict.
Ask What Is Behind the Picture
When we see an impressive aerial image, point cloud, three-dimensional model, or digital twin, we should appreciate what the technology allows us to do. We should also ask where the information came from, what it is referenced to, how accurate it is, how that accuracy was tested, whether the measurements can be reproduced, and whether the information is suitable for the decision.
A picture helps us see.
A map helps us understand.
A model helps us explore.
A controlled survey dataset supports measurements that can be checked and repeated.
When the decision depends upon an accurate position, elevation, dimension, clearance, quantity, or relationship –
GET IT MEASURED. GET IT CONTROLLED. GET IT CHECKED.
GET IT SURVEYED.
Robert L. Young, RPLS 5400 • Trans Texas Surveying & Mapping
GIS — Get It Surveyed™ | A Robert L. Young Educational and Book Series
© 2026 Robert L. Young. All rights reserved. Reproduction or distribution requires written permission, except as permitted by law.